Pokémon Correlations
Purpose
To explore basic Machine Learning concepts (regression) and python packages with data I already understand. I will specifically use Pokémon stats to explore potential correlations. I also tried to use loops where possible.
import pandas as pd
import numpy as np
import matplotlib as mpl
import matplotlib.pyplot as plt
import plotly as pl
import plotly.express as px
import scipy as sp
import scipy.stats
import seaborn as sns
from sklearn.linear_model import LinearRegression
from sklearn.preprocessing import LabelEncoder, OneHotEncoder

plt.style.use("classic")
%matplotlib inline
Loading in Data
pokedex_raw = pd.read_csv("pokedex_(Update_05.20).csv", index_col=0)
Filtering Data to Releavnt Columns
pokemon1 = pokedex_raw[[
    'pokedex_number', 'name', 'generation', 'type_1', 'type_2','total_points', 'hp', 'attack', 'defense',
       'sp_attack', 'sp_defense', 'speed'
]].copy()
pokemon1["type_2"].fillna("None", inplace=True)

pokemon1 = pokemon1.astype("int64", errors="ignore")
pokemon1 = pokemon1.astype({
    "name": "string",
    "type_1": "string",
    "type_2": "string"
    })
Making Recursive Type Tables
type_1c = pd.unique(pokemon1["type_1"])
type_2c = pd.unique(pokemon1["type_2"])
type_2c

pokemon2 = {x: pd.DataFrame() for x in type_1c}
pokemon3 = {x: pd.DataFrame() for x in type_2c}

for x in type_1c:
    pokemon2[x] = pokemon1.loc[pokemon1["type_1"] == x]

for x in type_2c:
    pokemon3[x] = pokemon1.loc[pokemon1["type_2"] == x]
Making Table for Legendary vs. Non-Legend
pokemon_l = pokedex_raw[['pokedex_number', 'name', 'generation','status','type_1', 'type_2','total_points', 'hp', 'attack', 'defense',
       'sp_attack', 'sp_defense', 'speed']].copy()
pokemon_l["type_2"].fillna("None", inplace=True)

pokemon_l = pokemon_l.astype("int64", errors="ignore")
pokemon_l = pokemon_l.astype({
    "name": "string",
    "type_1": "string",
    "type_2": "string",
    "status": "string"
    })

pokemon_legend = pokemon_l.loc[pokemon_l['status'].isin(["Legendary","Mythical"]) ]
pokemon_normal = pokemon_l.loc[pokemon_l['status'].isin(["Normal","Sub Legendary"])]
Making Tables for Heatmap
pokemon_h = pokedex_raw[['status','type_1', 'type_2','total_points']].copy()
pokemon_h["type_2"].fillna("None", inplace=True)

pokemon_h = pokemon_h.astype("int64", errors="ignore")
pokemon_h = pokemon_h.astype({
    "type_1": "category",
    "type_2": "category",
    "status": "category"
    })

pokemon_h_cols = pd.get_dummies(pokemon_h, columns=["type_1", "type_2", "status"], prefix=("Type_1", "Type_2", "Status"))
Matplotlib
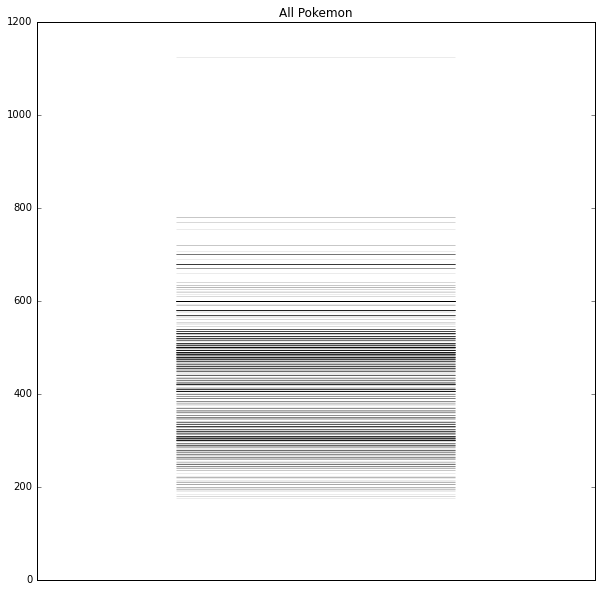
In order to get a better idea of the distribution for the relationship between a Pokémon’s main, or the first type, and their overall power, I have plotted the following:
fig, pkmn_p = plt.subplots(constrained_layout = False, figsize=(10,10))
pkmn_p.xaxis.set_visible(False)
pkmn_p.set_title("All Pokemon")
pkmn_p.set_ylim([0, 1200])

for x in type_1c:
    pkmn_p.eventplot(pokemon2[x]["total_points"], orientation="vertical", linewidth=0.75, color ="black", alpha=0.1)

plt.show()
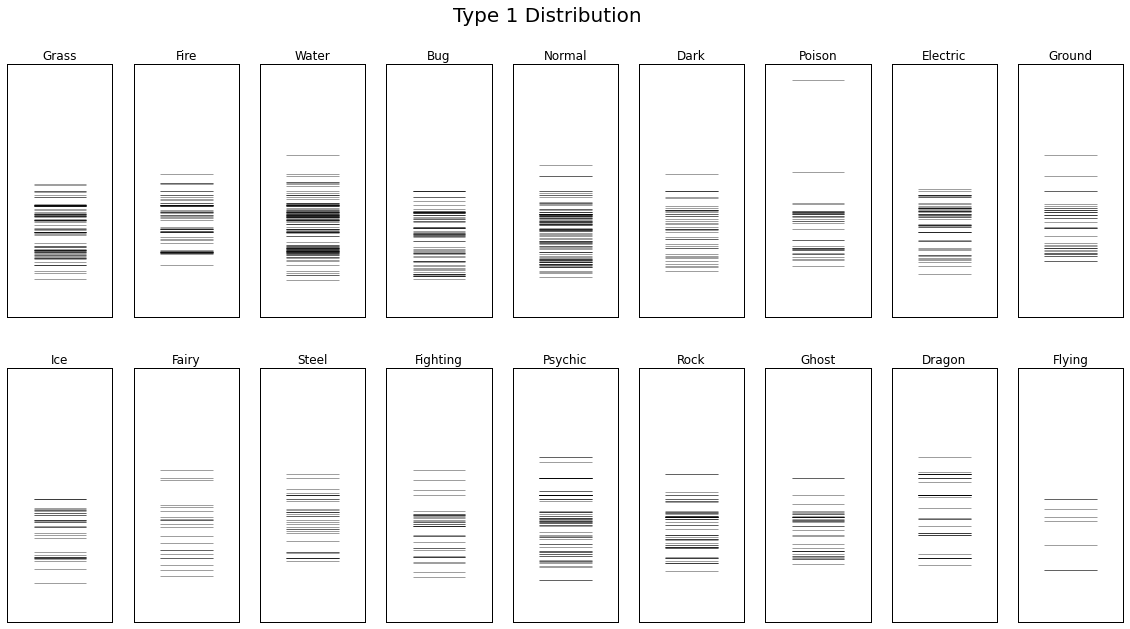
fig, pkmn_p2 = plt.subplots(2,9, constrained_layout = False, figsize=(20,10))
fig.suptitle("Type 1 Distribution", fontsize = 20)

i = [0,1,2,3,4,5,6,7,8]
j = [0,1]

for x in i:
    for z in j:
        pkmn_p2[z,x].xaxis.set_visible(False)
        pkmn_p2[z,x].yaxis.set_visible(False)

n=-1
m=-10

for x in type_1c:
    n = n+1
    m = m+1
    if n < 9:
        pkmn_p2[0,n].eventplot(pokemon2[x]["total_points"], orientation="vertical", linewidth=0.75, color="black", alpha=0.5)
        pkmn_p2[0,n].set_title(x)
        pkmn_p2[0,n].set_ylim([0, 1200])
    else:
        pkmn_p2[1,m].eventplot(pokemon2[x]["total_points"], orientation="vertical", linewidth=0.75, color="black", alpha=0.5)
        pkmn_p2[1,m].set_title(x)
        pkmn_p2[1,m].set_ylim([0, 1200])


plt.show()
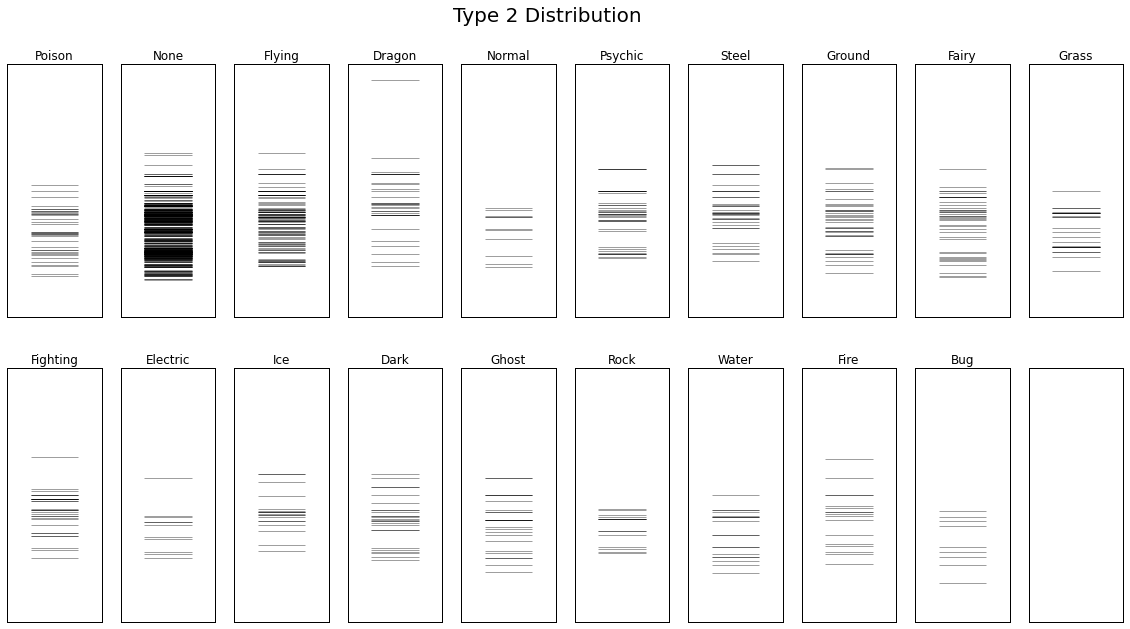
fig, pkmn_p3 = plt.subplots(2,10, constrained_layout = False, figsize=(20,10))
fig.suptitle("Type 2 Distribution", fontsize = 20)

i = [0,1,2,3,4,5,6,7,8,9]
j = [0,1]

for x in i:
    for z in j:
        pkmn_p3[z,x].xaxis.set_visible(False)
        pkmn_p3[z,x].yaxis.set_visible(False)

n=-1
m=-11

for x in type_2c:
    n = n+1
    m = m+1
    if n < 10:
        pkmn_p3[0,n].eventplot(pokemon3[x]["total_points"], orientation="vertical", linewidth=0.75, color="black", alpha=0.5)
        pkmn_p3[0,n].set_title(x)
        pkmn_p3[0,n].set_ylim([0, 1200])
    else:
        pkmn_p3[1,m].eventplot(pokemon3[x]["total_points"], orientation="vertical", linewidth=0.75, color="black", alpha=0.5)
        pkmn_p3[1,m].set_title(x)
        pkmn_p3[1,m].set_ylim([0, 1200])


plt.show()
Here, we can see various first type distributions on overall power (total_power).
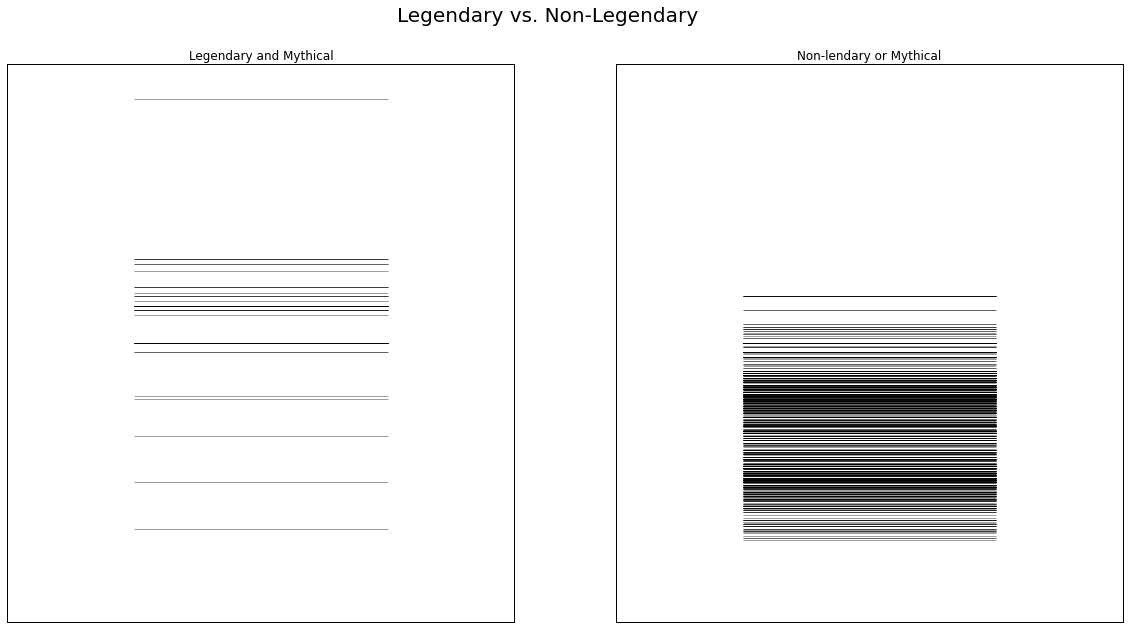
fig, pkmn_p3 = plt.subplots(1,2, constrained_layout = False, figsize=(20,10))
fig.suptitle("Legendary vs. Non-Legendary", fontsize = 20)

i=[0,1]

for x in i:
    pkmn_p3[x].xaxis.set_visible(False)
    pkmn_p3[x].yaxis.set_visible(False)

pkmn_p3[0].eventplot(pokemon_legend["total_points"], orientation="vertical", linewidth=0.75, color="black", alpha=0.5)
pkmn_p3[0].set_title("Legendary and Mythical")
pkmn_p3[0].set_ylim([0, 1200])
pkmn_p3[1].eventplot(pokemon_normal["total_points"], orientation="vertical", linewidth=0.75, color="black", alpha=0.5)
pkmn_p3[1].set_title("Non-lendary or Mythical")
pkmn_p3[1].set_ylim([0, 1200])


plt.show()
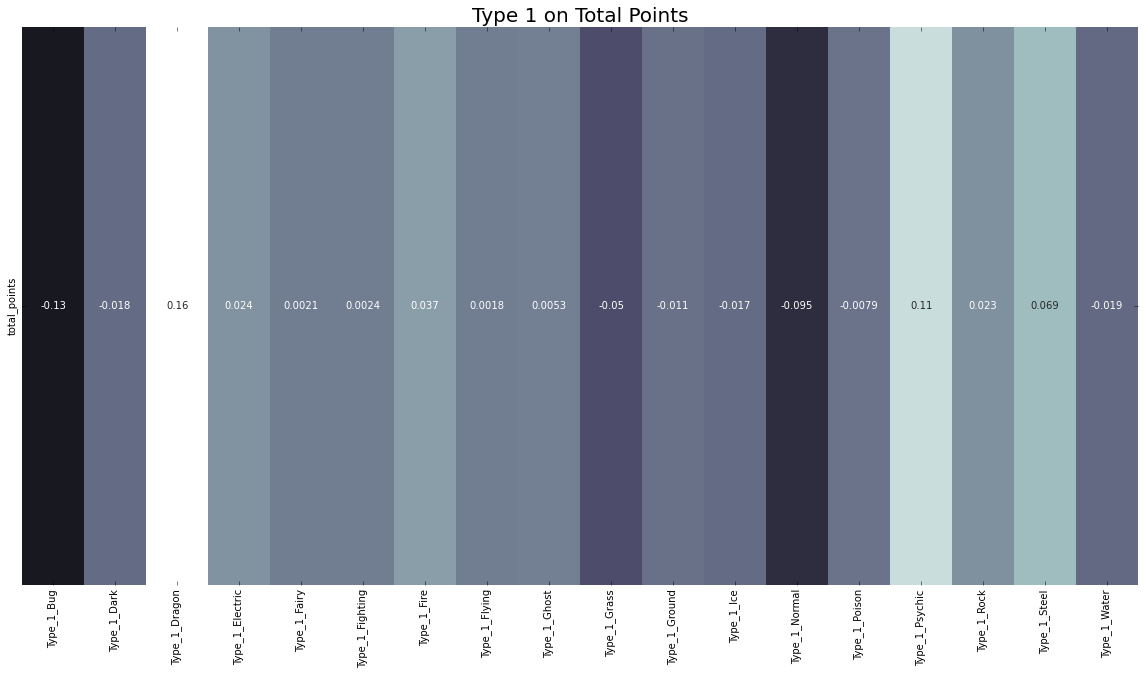
Correlation Plots
pokemon_h_corr1 = pokemon_h_cols.corr()

pokemon_h_corr1 = pokemon_h_corr1.loc[:,['Type_1_Bug', 'Type_1_Dark', 'Type_1_Dragon',
       'Type_1_Electric', 'Type_1_Fairy', 'Type_1_Fighting', 'Type_1_Fire',
       'Type_1_Flying', 'Type_1_Ghost', 'Type_1_Grass', 'Type_1_Ground',
       'Type_1_Ice', 'Type_1_Normal', 'Type_1_Poison', 'Type_1_Psychic',
       'Type_1_Rock', 'Type_1_Steel', 'Type_1_Water']].copy()

pokemon_h_corr1 = pokemon_h_corr1.loc[["total_points"]]

plt.figure(figsize=(20,10))
plt.title("Type 1 on Total Points", size=20)
pkmn_h1 = sns.heatmap(pokemon_h_corr1, cbar=False, annot=True, center=0, cmap="bone")
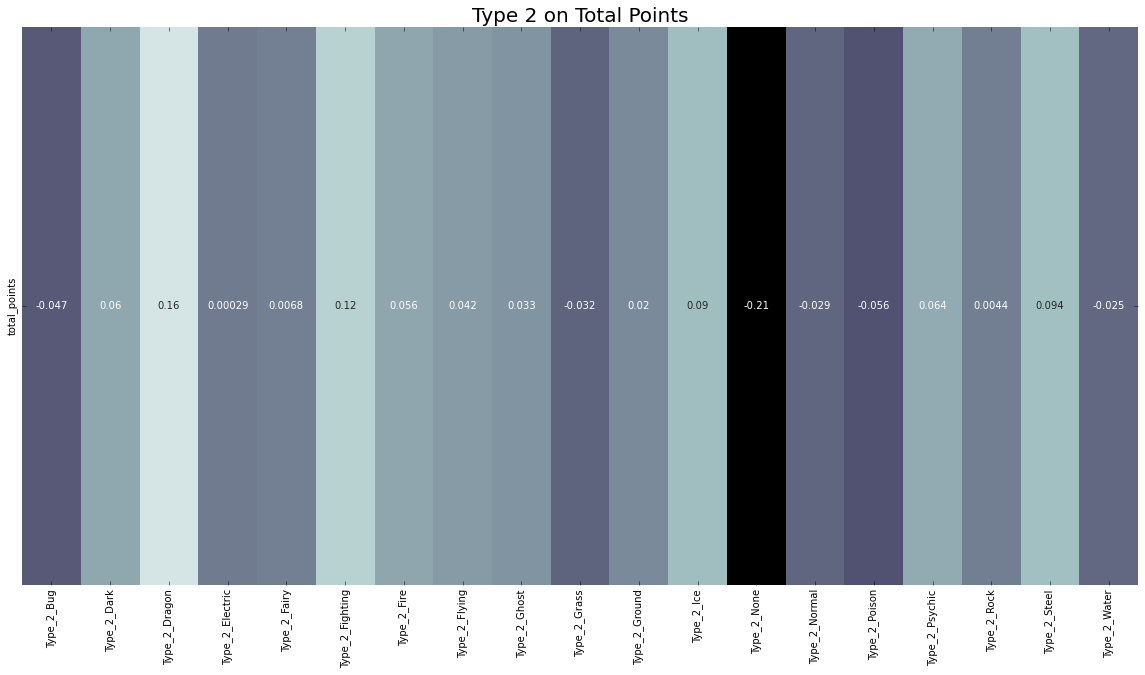
pokemon_h_corr2 = pokemon_h_cols.corr()

pokemon_h_corr2 = pokemon_h_corr2.loc[:,['Type_2_Bug',
       'Type_2_Dark', 'Type_2_Dragon', 'Type_2_Electric', 'Type_2_Fairy',
       'Type_2_Fighting', 'Type_2_Fire', 'Type_2_Flying', 'Type_2_Ghost',
       'Type_2_Grass', 'Type_2_Ground', 'Type_2_Ice', 'Type_2_None',
       'Type_2_Normal', 'Type_2_Poison', 'Type_2_Psychic', 'Type_2_Rock',
       'Type_2_Steel', 'Type_2_Water']].copy()

pokemon_h_corr2 = pokemon_h_corr2.loc[["total_points"]]

plt.figure(figsize=(20,10))
plt.title("Type 2 on Total Points", size=20)
pkmn_h2 = sns.heatmap(pokemon_h_corr2, cbar=False, annot=True, center=0, cmap="bone")
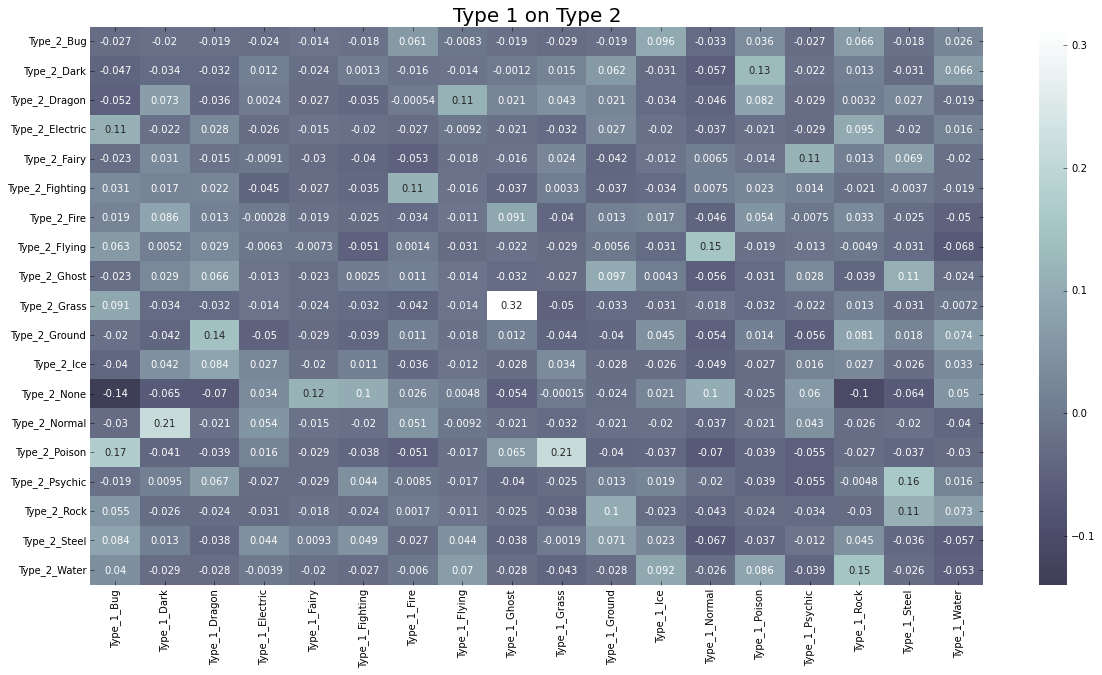
pokemon_h_corr3 = pokemon_h_cols.corr()

pokemon_h_corr3 = pokemon_h_corr3.loc[:,['Type_1_Bug', 'Type_1_Dark', 'Type_1_Dragon',
       'Type_1_Electric', 'Type_1_Fairy', 'Type_1_Fighting', 'Type_1_Fire',
       'Type_1_Flying', 'Type_1_Ghost', 'Type_1_Grass', 'Type_1_Ground',
       'Type_1_Ice', 'Type_1_Normal', 'Type_1_Poison', 'Type_1_Psychic',
       'Type_1_Rock', 'Type_1_Steel', 'Type_1_Water']].copy()

pokemon_h_corr3 = pokemon_h_corr3.loc[['Type_2_Bug',
       'Type_2_Dark', 'Type_2_Dragon', 'Type_2_Electric', 'Type_2_Fairy',
       'Type_2_Fighting', 'Type_2_Fire', 'Type_2_Flying', 'Type_2_Ghost',
       'Type_2_Grass', 'Type_2_Ground', 'Type_2_Ice', 'Type_2_None',
       'Type_2_Normal', 'Type_2_Poison', 'Type_2_Psychic', 'Type_2_Rock',
       'Type_2_Steel', 'Type_2_Water']]

plt.figure(figsize=(20,10))
plt.title("Type 1 on Type 2", size=20)
pkmn_h3 = sns.heatmap(pokemon_h_corr3, cbar=True, annot=True, center=0, cmap="bone")
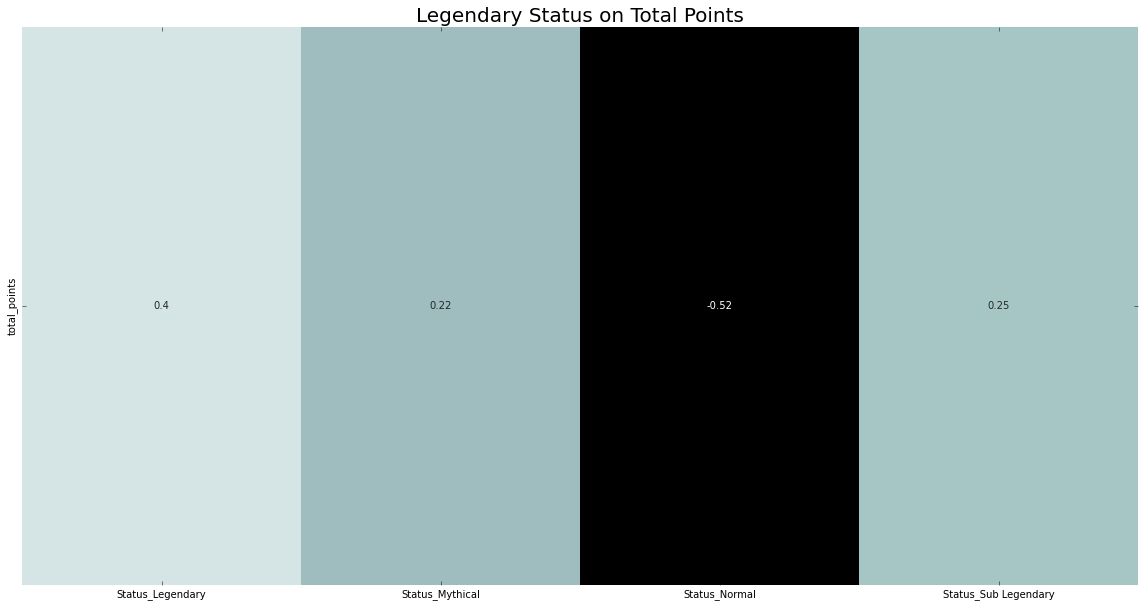
pokemon_h_corr4 = pokemon_h_cols.corr()

pokemon_h_corr4 = pokemon_h_corr4.loc[:,['Status_Legendary',
       'Status_Mythical', 'Status_Normal', 'Status_Sub Legendary']].copy()

pokemon_h_corr4 = pokemon_h_corr4.loc[["total_points"]]

plt.figure(figsize=(20,10))
plt.title("Legendary Status on Total Points", size=20)
pkmn_h4 = sns.heatmap(pokemon_h_corr4, cbar=False, annot=True, center=0, cmap="bone")
Multiple Linear Regression Model
While no calculated coefficient is particularly large, it would still be interesting to see what multi-regression equation can be made from the data to predict total power for a hypothetical Pokémon.
pokemon_h_cols.columns
    Index(['total_points', 'Type_1_Bug', 'Type_1_Dark', 'Type_1_Dragon',
           'Type_1_Electric', 'Type_1_Fairy', 'Type_1_Fighting', 'Type_1_Fire',
           'Type_1_Flying', 'Type_1_Ghost', 'Type_1_Grass', 'Type_1_Ground',
           'Type_1_Ice', 'Type_1_Normal', 'Type_1_Poison', 'Type_1_Psychic',
           'Type_1_Rock', 'Type_1_Steel', 'Type_1_Water', 'Type_2_Bug',
           'Type_2_Dark', 'Type_2_Dragon', 'Type_2_Electric', 'Type_2_Fairy',
           'Type_2_Fighting', 'Type_2_Fire', 'Type_2_Flying', 'Type_2_Ghost',
           'Type_2_Grass', 'Type_2_Ground', 'Type_2_Ice', 'Type_2_None',
           'Type_2_Normal', 'Type_2_Poison', 'Type_2_Psychic', 'Type_2_Rock',
           'Type_2_Steel', 'Type_2_Water', 'Status_Legendary', 'Status_Mythical',
           'Status_Normal', 'Status_Sub Legendary'],
          dtype='object')
pokemon_reg = pokemon_h_cols
x = pokemon_reg [['Type_1_Bug', 'Type_1_Dark', 'Type_1_Dragon',
       'Type_1_Electric', 'Type_1_Fairy', 'Type_1_Fighting', 'Type_1_Fire',
       'Type_1_Flying', 'Type_1_Ghost', 'Type_1_Grass', 'Type_1_Ground',
       'Type_1_Ice', 'Type_1_Normal', 'Type_1_Poison', 'Type_1_Psychic',
       'Type_1_Rock', 'Type_1_Steel', 'Type_1_Water', 'Type_2_Bug',
       'Type_2_Dark', 'Type_2_Dragon', 'Type_2_Electric', 'Type_2_Fairy',
       'Type_2_Fighting', 'Type_2_Fire', 'Type_2_Flying', 'Type_2_Ghost',
       'Type_2_Grass', 'Type_2_Ground', 'Type_2_Ice', 'Type_2_None',
       'Type_2_Normal', 'Type_2_Poison', 'Type_2_Psychic', 'Type_2_Rock',
       'Type_2_Steel', 'Type_2_Water', 'Status_Legendary', 'Status_Mythical',
       'Status_Normal', 'Status_Sub Legendary']]

y = pokemon_reg['total_points']

pkmn_mlr = LinearRegression()
pkmn_mlr.fit(x,y)

print("Intercept: ", pkmn_mlr.intercept_)
print("Coefficients:")
list(zip(x, pkmn_mlr.coef_))
    Intercept:  4143338107306098.5
    Coefficients:
    [('Type_1_Bug', -3807471977839108.0),
     ('Type_1_Dark', -3807471977839072.5),
     ('Type_1_Dragon', -3807471977839015.0),
     ('Type_1_Electric', -3807471977839035.0),
     ('Type_1_Fairy', -3807471977839043.0),
     ('Type_1_Fighting', -3807471977839039.5),
     ('Type_1_Fire', -3807471977839029.0),
     ('Type_1_Flying', -3807471977839079.0),
     ('Type_1_Ghost', -3807471977839040.5),
     ('Type_1_Grass', -3807471977839062.5),
     ('Type_1_Ground', -3807471977839065.5),
     ('Type_1_Ice', -3807471977839041.0),
     ('Type_1_Normal', -3807471977839068.0),
     ('Type_1_Poison', -3807471977839067.5),
     ('Type_1_Psychic', -3807471977839047.0),
     ('Type_1_Rock', -3807471977839044.0),
     ('Type_1_Steel', -3807471977839034.0),
     ('Type_1_Water', -3807471977839048.5),
     ('Type_2_Bug', 6170475426273.1455),
     ('Type_2_Dark', 6170475426380.471),
     ('Type_2_Dragon', 6170475426392.167),
     ('Type_2_Electric', 6170475426330.988),
     ('Type_2_Fairy', 6170475426317.483),
     ('Type_2_Fighting', 6170475426379.596),
     ('Type_2_Fire', 6170475426358.753),
     ('Type_2_Flying', 6170475426334.623),
     ('Type_2_Ghost', 6170475426324.181),
     ('Type_2_Grass', 6170475426314.202),
     ('Type_2_Ground', 6170475426326.583),
     ('Type_2_Ice', 6170475426377.995),
     ('Type_2_None', 6170475426307.798),
     ('Type_2_Normal', 6170475426305.408),
     ('Type_2_Poison', 6170475426318.524),
     ('Type_2_Psychic', 6170475426350.353),
     ('Type_2_Rock', 6170475426351.304),
     ('Type_2_Steel', 6170475426365.589),
     ('Type_2_Water', 6170475426315.487),
     ('Status_Legendary', -342036604892725.25),
     ('Status_Mythical', -342036604892781.5),
     ('Status_Normal', -342036604892952.9),
     ('Status_Sub Legendary', -342036604892801.94)]
from sklearn.model_selection import train_test_split
from sklearn import metrics

x_train, x_test, y_train, y_test = train_test_split(x, y, test_size = 0.3, random_state = 100)

y_pred_pkmn_mlr = pkmn_mlr.predict(x_test)

pkmn_mlr_diff = pd.DataFrame({"Actual Value": y_test, "Predicted Value": y_pred_pkmn_mlr})

pkmn_mlr_diff["Percentage Difference"] = (abs((pkmn_mlr_diff["Actual Value"] - pkmn_mlr_diff["Predicted Value"]))/((pkmn_mlr_diff["Actual Value"] + pkmn_mlr_diff["Predicted Value"])/2))*100

pkmn_mlr_diff.agg({"Percentage Difference":  ["mean", "median", "min", "max"]})
| Percentage Difference | |
|---|---|
| mean | 20.794235 |
| median | 19.451908 |
| min | 0.000000 |
| max | 67.768595 |
from sklearn import metrics

meanAbErr = metrics.mean_absolute_error(y_test, y_pred_pkmn_mlr)
meanSqErr = metrics.mean_squared_error(y_test, y_pred_pkmn_mlr)
rootMeanSqErr = np.sqrt(metrics.mean_squared_error(y_test, y_pred_pkmn_mlr))

print('R squared: {:.2f}'.format(pkmn_mlr.score(x,y)*100))
print('Mean Absolute Error:', meanAbErr)
print('Mean Square Error:', meanSqErr)
print('Root Mean Square Error:', rootMeanSqErr)
    R squared: 35.94
    Mean Absolute Error: 83.04854368932038
    Mean Square Error: 9344.140776699029
    Root Mean Square Error: 96.66509595867078
While the multiple regression linear model technically works, the results are unfortunately statistically insignificant, meaning there is either low correlation between variables or the model itself is not the ‘best’. This is not surprising though, as Pokémon and their stats are incredibly diverse, so a clear relation between types would make both general and competitive play unbalanced.